Для многих участников рынка криптовалют, особенно начинающих, торговый объём (англ. trading volume) может показаться лишь дополнительной цифрой в графиках и таблицах. Однако опытные трейдеры знают, что это один из ключевых показателей, помогающий понять «здоровье» рынка, его ликвидность и готовность участников к сделкам. В этой статье мы разберём, что именно значит «торговый объём» в контексте крипты, как его использовать при анализе рынка и почему игнорировать этот параметр — значит упускать важный слой информации для торговых решений.

Торговый объём (trading volume) — это сумма (или количество) токенов/монет, купленных и проданных за определённый период (например, за сутки). Иными словами, если в течение 24 часов на бирже X пользователи совершили сделки на 10 000 BTC, то объём торгов (24h volume) для BTC там составил 10 000 единиц. Часто этот показатель выражается также в фиатном эквиваленте (долларах, евро), указывая общую денежную ценность сделок.
Этот показатель отражает, насколько активно люди торгуют определённым активом и какова общая ликвидность. Высокий объём говорит о том, что желающие купить и продать монету легко найдут себе партнёров в сделках, тогда как низкий объём намекает на сложность быстрого входа/выхода, а значит — повышенные риски проскальзывания.
Ликвидность — способность рынка быстро «переварить» крупные сделки без существенного влияния на цену. Если объём торгов высок, это обычно означает, что в стакане (order book) много заявок на покупку и продажу, и крупный игрок сможет купить/продать серьёзные объёмы без значительного изменения стоимости. Низкие объёмы грозят:
Именно поэтому, приступая к торговле или инвестированию, трейдеры часто проверяют volume, чтобы убедиться: актив достаточно «живой» и проблем с исполнением ордеров не возникнет.
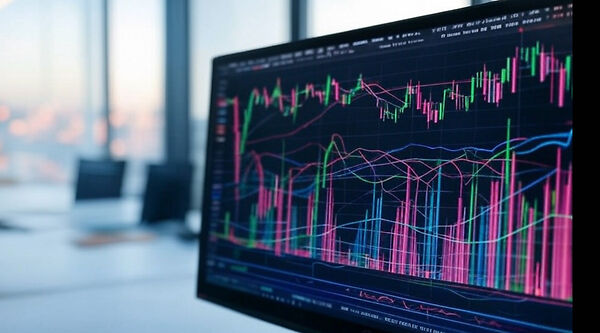
В техническом анализе объём (volume) традиционно изображается в виде гистограммы (столбиков) под основным ценовым графиком. Существует несколько паттернов:
Также трейдеры используют индикаторы вроде On-Balance Volume (OBV) или Volume Profile для оценки динамики накопления/распределения токенов. Совокупность «цены + объём» позволяет глубже понимать «намерения рынка».
В централизованных биржах (CEX) торговый объём отражает сделки в ордербуке. Однако часть таких объёмов может быть «подделана» (wash trading), если сама биржа или боты создают фиктивные ордера. С другой стороны, децентрализованные биржи (DEX) обычно «честны», так как каждая сделка регистрируется в блокчейне. Но и тут:
Сейчас многие аналитические порталы (Dune Analytics, DeFiLlama) собирают данные как по CEX, так и по DEX, чтобы формировать более полную картину «глобального» объёма.
Инвесторы и трейдеры могут извлекать выгоду из анализа объёма следующими способами:
Также объём помогает понять, «жив» ли DeFi-протокол или токен. Если daily volume ничтожно мал, то ликвидность не даёт шансов быстро выйти/войти без потерь.
Несмотря на полезность trading volume, он не является «волшебной палочкой»:
Поэтому объём полезно сочетать с анализом ордербука, фундаментальных новостей и других технических индикаторов, формируя более комплексную оценку рынка.
Торговый объём (trading volume) в криптовалюте — это не просто цифра на графике, а мощный индикатор, который раскрывает динамику ликвидности и интереса к определённому активу. Понимание объёма даёт трейдерам и инвесторам важнейшие подсказки об устойчивости тренда, вероятности манипуляций и перспективе дальнейшего движения цены. В эпоху, когда DeFi, NFT и Layer-2-сети формируют новые сегменты рынка, объём на разных биржах (CEX и DEX) становится ещё более значимым показателем, помогающим отличить реальный спрос от «шумового» движения. Однако важно помнить о рисках «прорисованных» объёмов (wash trading) и не полагаться исключительно на этот индикатор. В сочетании с фундаментальным анализом, наблюдением за эмоциями рынка и техническими паттернами, торговый объём остаётся одним из главных инструментов в арсенале криптотрейдера, помогающим ориентироваться в стремительно меняющемся ландшафте блокчейна и цифровых активов.